NFL Teams & Social Media: The Winner’s Playbook
WINNING + FAN BASE + LEGACY =
CONTENT + CONNECTIONS + RELATIONSHIPS
I’ve been afforded the pleasure and opportunity to guest-post on the top-rated blog {grow} by respected social media specialist Mark Schaefer. If you’re a regular visitor to {grow}, and that article (posted 1/31) led you here for a more in-depth look at the data, welcome. If you came here first, and haven’t read the post on Mark’s site, visit http://www.businessesgrow.com/blog/. Go there if you are a social media professional, have an interest in social media and marketing thought-leadership, or just enjoy engaging and relevant discussion and guidance regarding the new reality of communication and connecting in the modern world. A day doesn’t pass where I don’t learn something from Mark and his community.
THE QUESTION:
All 32 NFL teams have Twitter and Facebook accounts. Each of these billion-dollar franchises is serious about tearing up the social media turf, and the numbers are clear. Like the win-loss column, the NFL social media effort includes big winners and a large group of also-rans.
Why the huge range from first to worst? The on-field and on-line stats help reveal why winners win, others lag, and why an enormous performance gap exists between the top- and bottom-ranked NFL social media initiatives.
SCOUTING REPORT: The NFL is huge and growing
- 34 of the 35 most-watched fall TV shows were NFL games; 205 million Americans watched at least one 2013 regular season game¹.
- 2012 league revenue eclipsed the $9 billion mark; Commissioner Goodell’s 5-step plan to increase revenue includes on-line activity, including fantasy football².
- League growth is aimed at younger Americans who represent a potential fan-base that could pay for tickets, jerseys, fantasy football memberships, and the products of big-ticket NFL sponsors for decades to come. This generation lives on-line. For an NFL team, a weak social presence isn’t an option.
TEAM STATS: For each team, performance metrics were logged six days before the Super Bowl
- On-line: Teams were ranked by their combined number of Twitter followers and Facebook Fans.
- Game Conditions: Stats regarding the environment in which each team operates its social strategy, including: (a) population within a 75-mile radius of team location – the potential “sphere of influence,” and (b) 2011-2013 regular season and playoff stats, including the number of playoff games played and won (excluding 2014 Super Bowl).
GAME FILM: The “tape” suggests 3 key factors; common strengths among the league’s Top-10 social media performers, shortcomings shared among the Bottom-10:
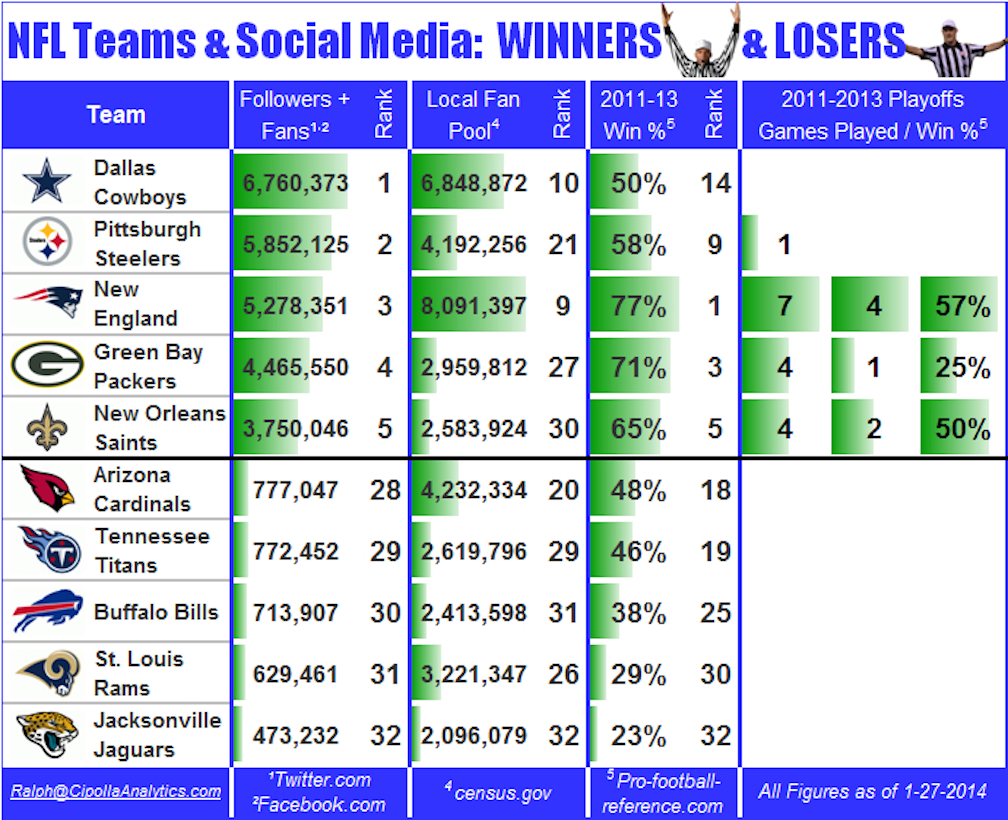
The Top- and Bottom-10 NFL teams, ranked by Social Media presence
#1: WINNING = STRONG CONTENT
THE WINNERS… win on the field – this is their “content.” The top-10 have won 31 of the 47 Super Bowls, and over the last 3 seasons:
- 9 teams have a 50% or better win-percentage
- 8 made the playoffs at least once, 4 teams went every year
THE LOSERS… have weak on-field “content” – it’s harder to convert “contacts” into fans. The bottom-10 hold only 3 of 47 Super Bowl trophies, and 2011-2013:
- Only 2 teams have a win-percentage 50% or better
- Only 3 made the playoffs at least once; none have won even a single game
#2: FAN BASE = CONNECTIONS & OPPORTUNITIES
THE WINNERS… take advantage of an opportunity to convert a large fan base.
- The top-10 collectively have over 85 million people within 75 miles of their stadiums
- They tend to be regional by geography and/or legacy; consider The Dallas Cowboys reputation as “America’s Team” and the fan-drawing power of teams in smaller cities like Pittsburgh and Green Bay, given their combined 10 Super Bowl wins.
THE LOSERS… have a smaller fan base, an opportunity they must maximize.
- The bottom-10 collectively have just over 36 million people living within a 75-mile radius; 42% of the top-10 local fan-base
- Tend to be local, isolated by geography and/or (poor) legacy.
#3: LEGACY = RELATIONSHIPS (GOOD or BAD)
THE WINNERS… have long history and a stable relationship with fans
- All top-10 teams are located in the same city in which the franchise was established³
THE LOSERS… have limited or dubious history, perhaps marked by brand instability and franchise moves
- 3 teams – Arizona, Tennessee, and St. Louis – “jilted” their fans in St. Louis, Houston, and L.A. before relocating to their new home
- Cleveland “broke off” a long-standing relationship with fans by moving to Baltimore; the brand was re-established locally 3 years later
- 2 teams – Carolina and Jacksonville – were established in new NFL cities in the ‘90s, relatively young when compared to a league full of teams whose roots date back to the 1920’s, including all those “young” AFL franchises formed in 1960.
Here, an in-depth look at all 32 NFL teams, ranked from top to bottom, with additional stats and colorful insight regarding:
- Facebook “Talking About” stats
- Facebook “Engagement” – the % of Fans “Talking About” the team
- Team Klout Score
- Local Fan Pool size
- Regular Season win percentage for the last 3 years (2011-2013), our measure of recent “content” quality
- Playoff performance 2011-2013; Years in the post-season / Games played / Games won / Win percentage
- The “Drought Factor” – number of years since a Playoff game played, and a Playoff game won (a painful subject for this life-long Buffalo Bills fan)
[Click to view] NFL & Social Media: The Big Grid
Additionally, we compared social web stats from December 30 (regular season over, playoff field set) so we could compare to January 27th (playoffs complete, only 2 SuperBowl teams remained), in the hopes that some interesting trending insights could be revealed. Below, I’ve isolated the 12 teams that made the 2013-2014 NFL Playoffs; the first to bow out are found at the bottom, and the two Super Bowl contenders are at the top. Observations:
- The longer a team survives, the longer they remain relevant and will continue to find more fans and followers. It’s no surprise that the greatest December-to-January percentage increases (generally) belong to teams that made it to the second or third round of the playoffs.
- Denver and Seattle continued to see their numbers grow as Super Bowl Sunday approached. The playoff first-round losers indeed made the post-season, but didn’t stick around long enough to leverage their regular season success.
[Click to view] NFL Playoff Teams: Social Media Trenders
- Look at the Facebook “People Are Talking About” stats. Apparently, this number does mean something. On December 30th, the playoff field had been set, not a game had been played, and all fans were ever-hopeful. One month later, the teams that lost their first- or second-round Wild Card or Divisional Round games have seen their in-the-moment “relevance” plummet. Of course; as the mood moves from “we’re going all the way!” to “wait ‘til next year,” people don’t quite feel like “talking about” their team. Conversely, as the only two teams left standing, the number of people following and the number of fans “talking about” The Broncos and The Seahawks increased significantly during the two-week period between the Championship Round and The Super Bowl. The challenge for the SuperBowl Champs? Seattle needs to leverage this new-found wealth of followers and fans into the off-season and through next fall. Below, I’ve isolated the stats for Seattle and Denver – the growth trend from January 27 to February 7. Yes, it would appear that “(a lot more) people are talking about” The Seattle Seahawks.

Seattle and Denver: Social Media stats on Jan 27, and Feb 7
POST-GAME SHOW: Conclusions
- Fundamentals: On and off the field, it’s about fundamentals: (a) a strong brand that represents high-quality content, (b) maximizing targeted connection opportunities, and (c) building strong, genuine, long-term relationships.
- Relevance: Winning = Relevance. Win big on-field, you increase your chances of winning on-line. The data shows that Denver and Seattle continued to see their social numbers grow, while early round playoff losers couldn’t quite leverage their regular season success.
- Tactics: Wait, you mean the top NFL social media players aren’t doing something really special? Clever contests? Leveraging star-power? We didn’t parse all the Tweets and Facebook posts for this exercise. Regardless, tactical short-strokes won’t go far unless you have a great brand and a strong product on the field.
Beyond the lesson in fundamentals, can you see a data-driven gem of insight among these stats? I’d love to hear your thoughts.
References: 1 – http://profootballtalk.nbcsports.com/2014/01/08/34-of-americas-35-most-watched-fall-tv-shows-were-nfl-games/ 2 – http://www.forbes.com/sites/monteburke/2013/08/17/how-the-national-football-league-can-reach-25-billion-in-annual-revenues/ 3 – Post-merger, “modern” NFL era